As a result of the MBO conducted by the Company's management, the Company's shares were delisted from the Tokyo Stock Exchange Standard Market as of October 30, 2024.
We would like to express our deepest gratitude to our shareholders and other stakeholders for their understanding and warm support of our management over the years since our listing.
We will continue to strive to further enhance our corporate value and contribute to society, and we would appreciate your continued understanding and support.
This page contains information that was publicly available before the delisting.
Financial Highlights
P/L
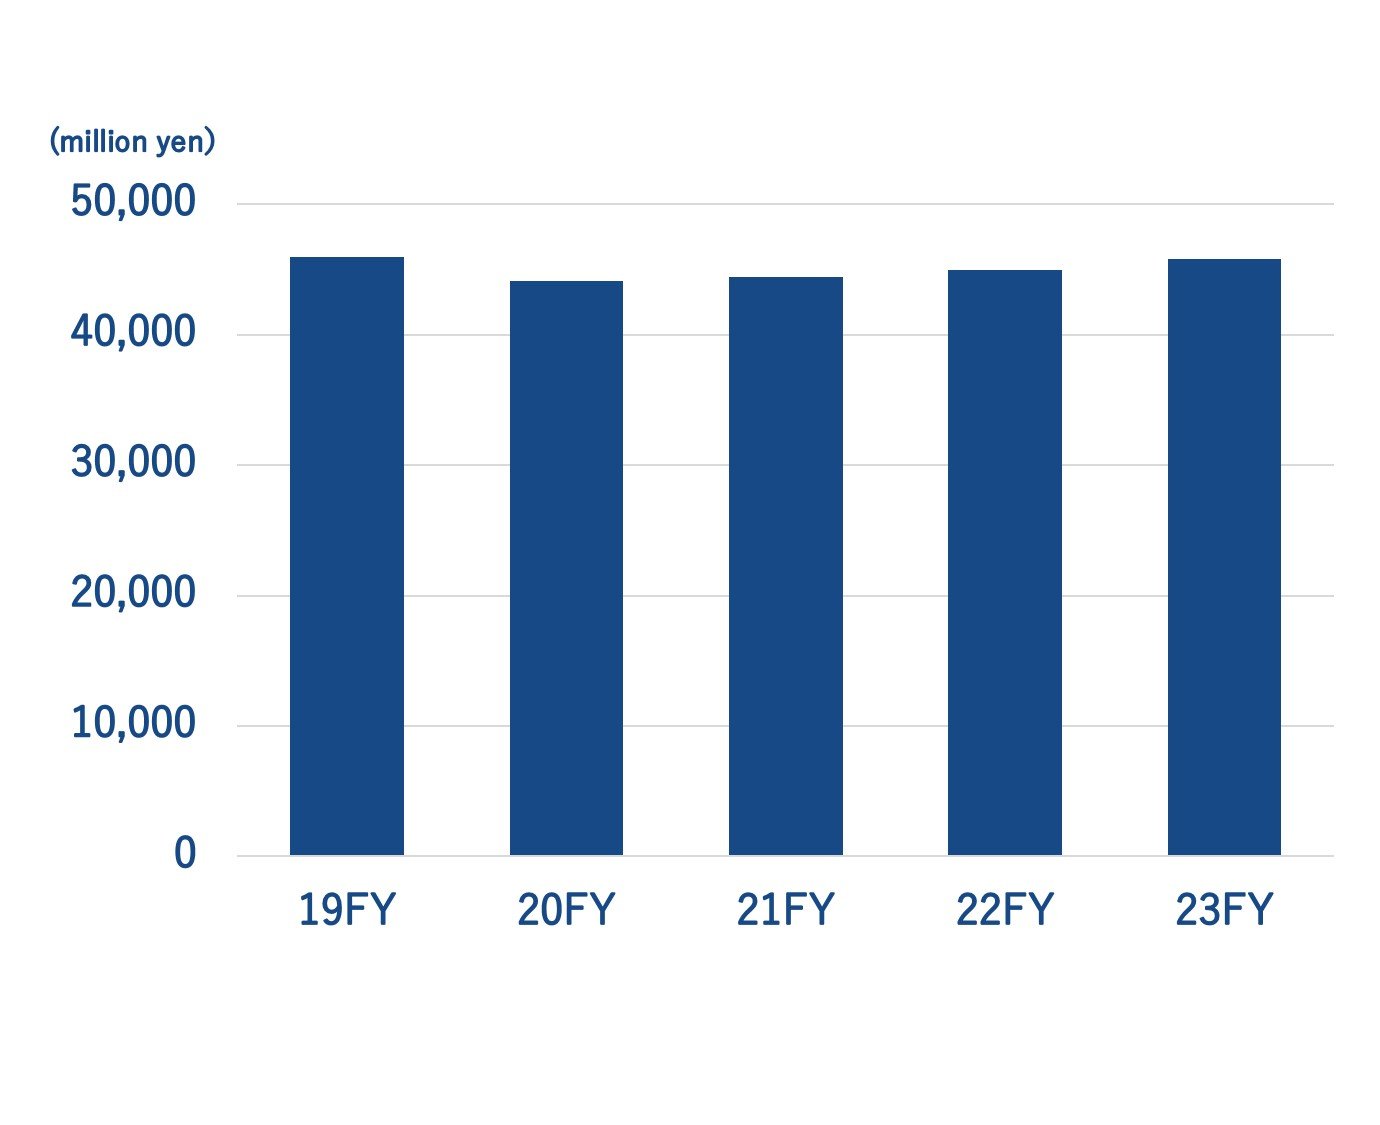
(Millions of yen)
| FY19 | FY20 | FY21 | FY22 | FY23 | |
| Net Sales | 45,934 | 44,119 | 44,419 | 44,926 | 45,785 |
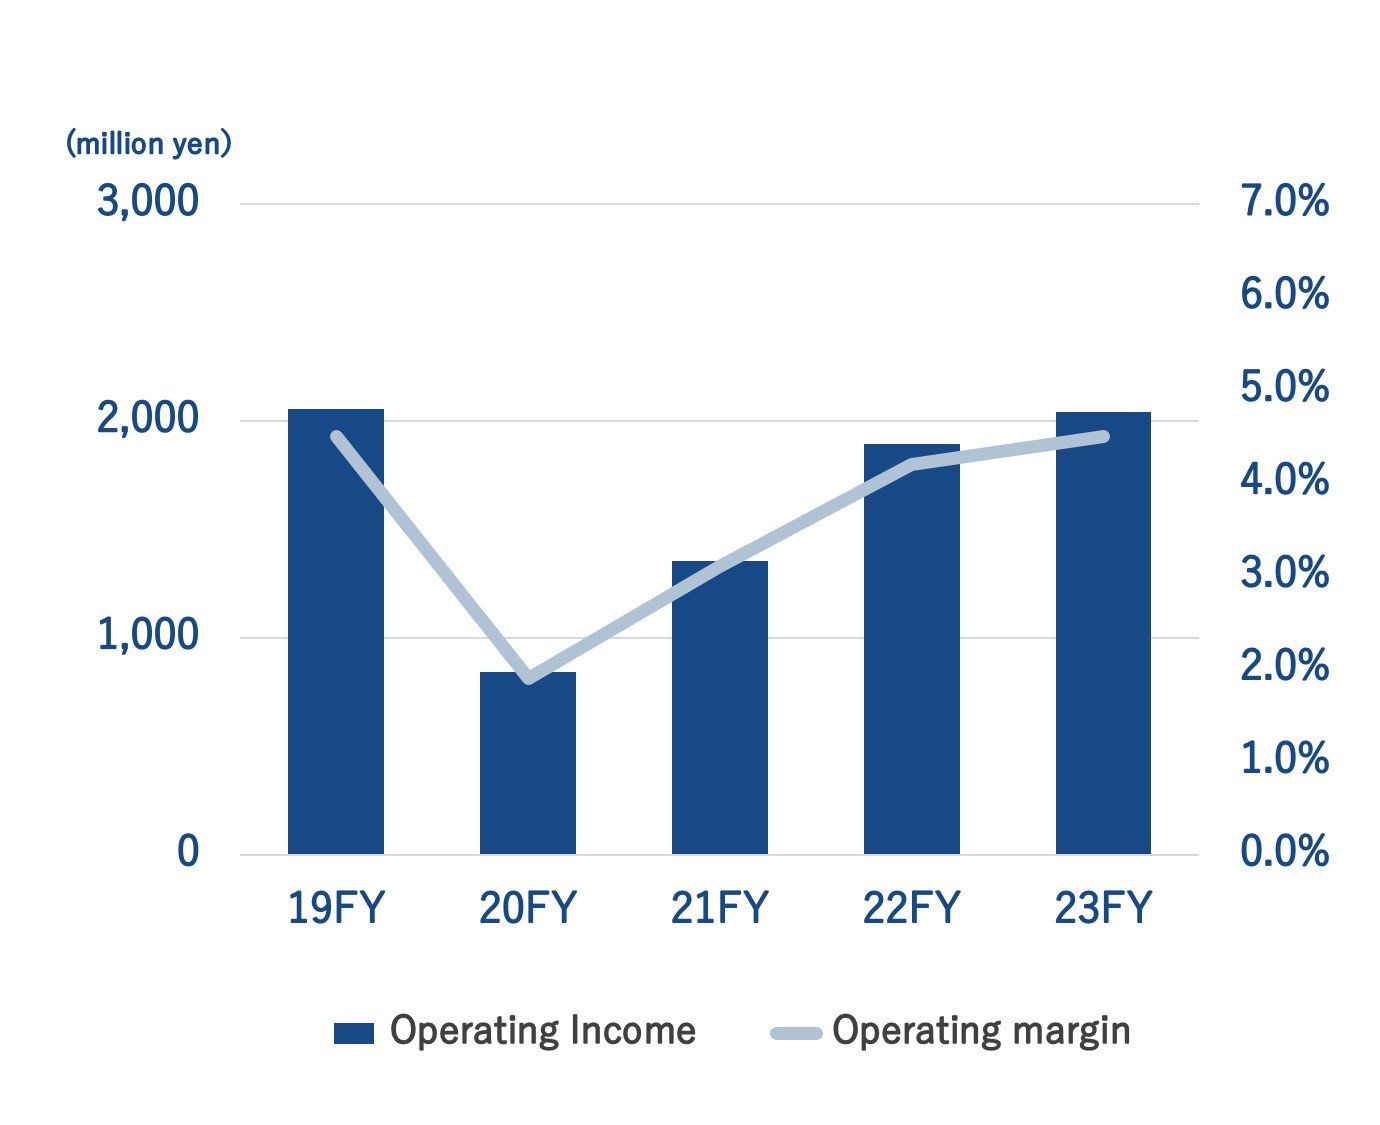
| Operating income | 2,055 | 840 | 1,356 | 1,893 | 2,042 |
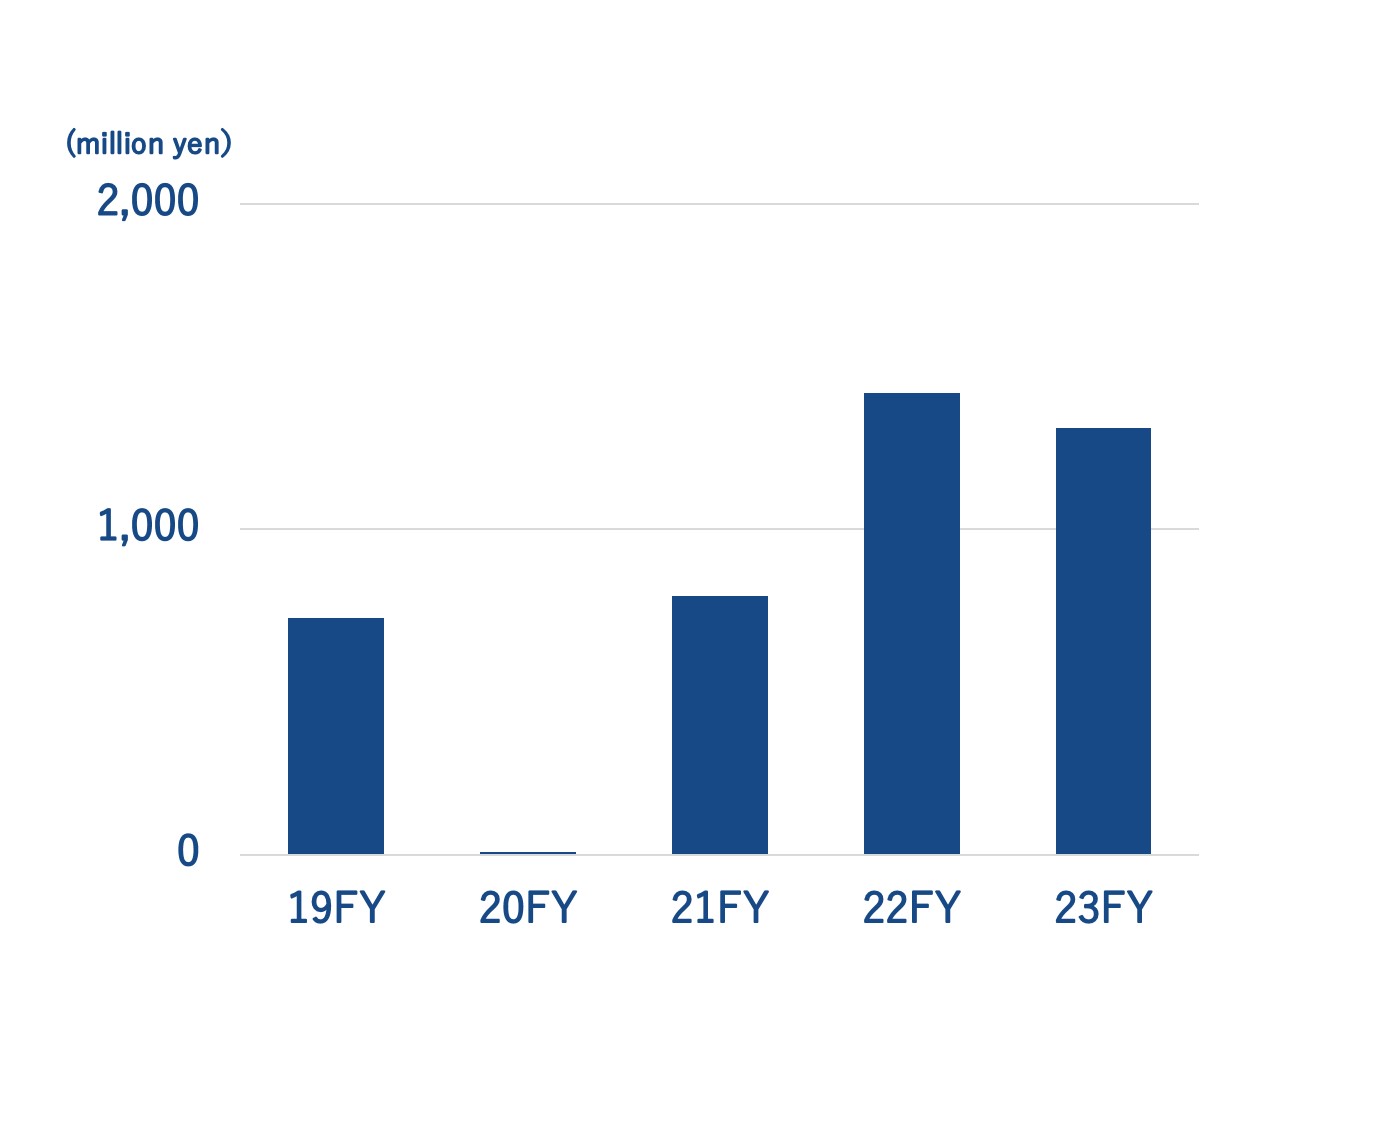
| Ordinary income | 729 | 8 | 795 | 1,419 | 1,312 |
| Profit | 272 | 166 | 602 | 262 | 573 |
Net Sales
Operating income and ratio
Ordinary income
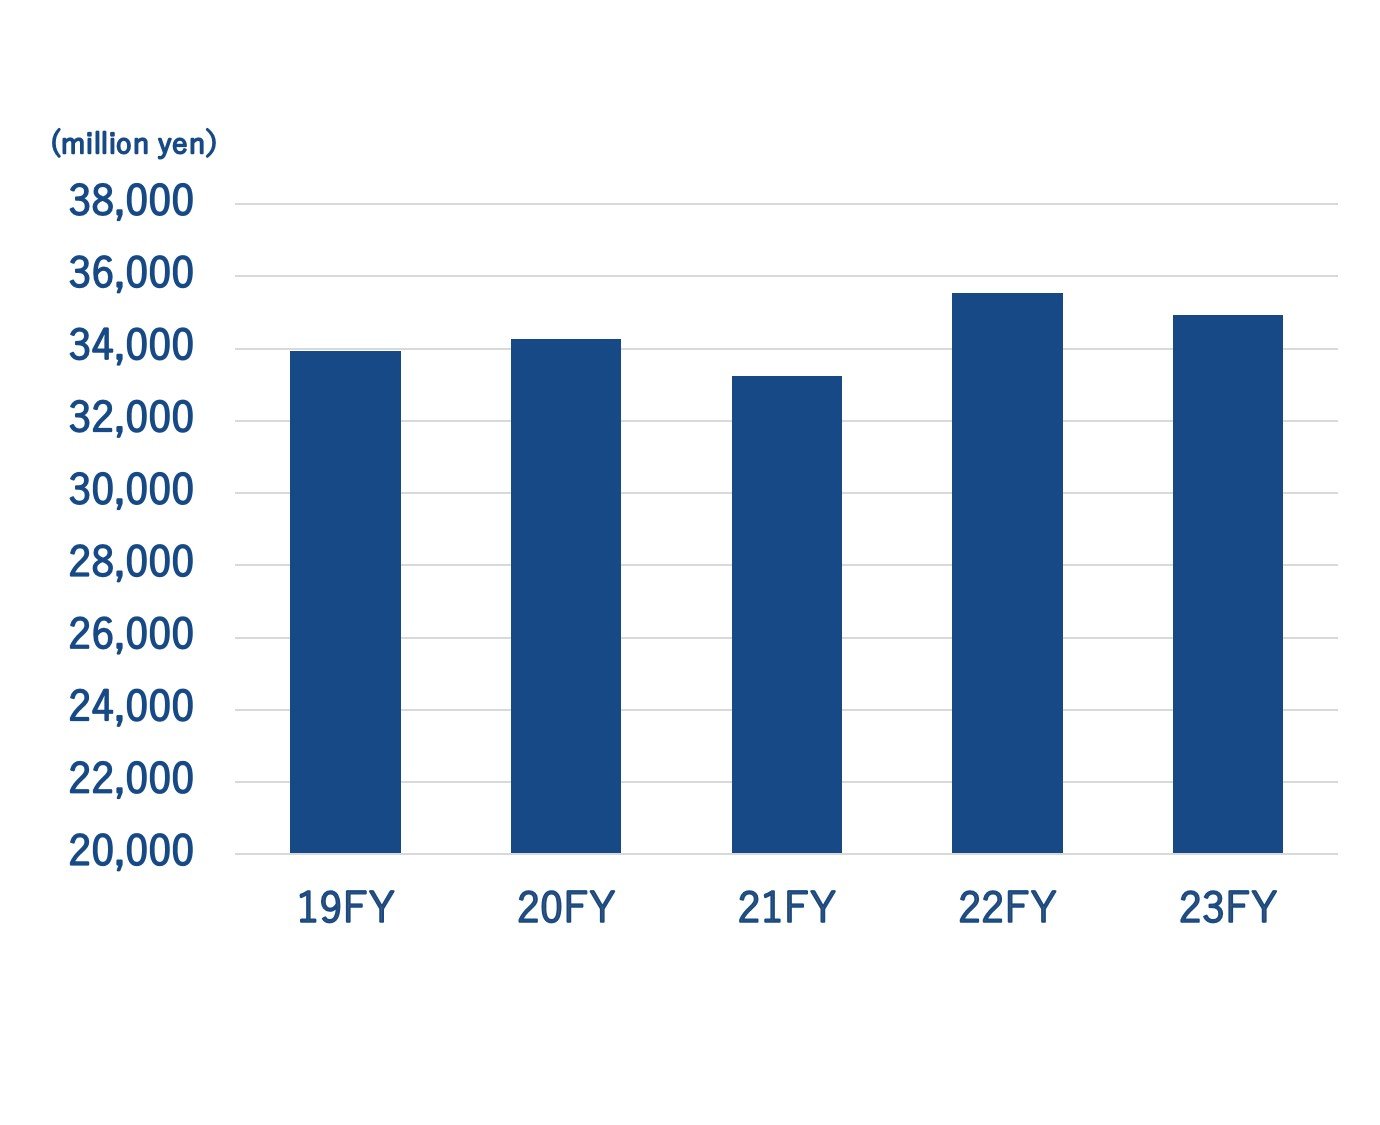
B/S
(Millions of yen)
| End FY19 | End FY20 | End FY21 | End FY22 | End FY23 | |
| Total assets | 33,929 | 34,255 | 33,241 | 35,545 | 34,944 |
| Interest-bearing debt | 19,224 | 20,810 | 19,255 | 20,471 | 19,101 |
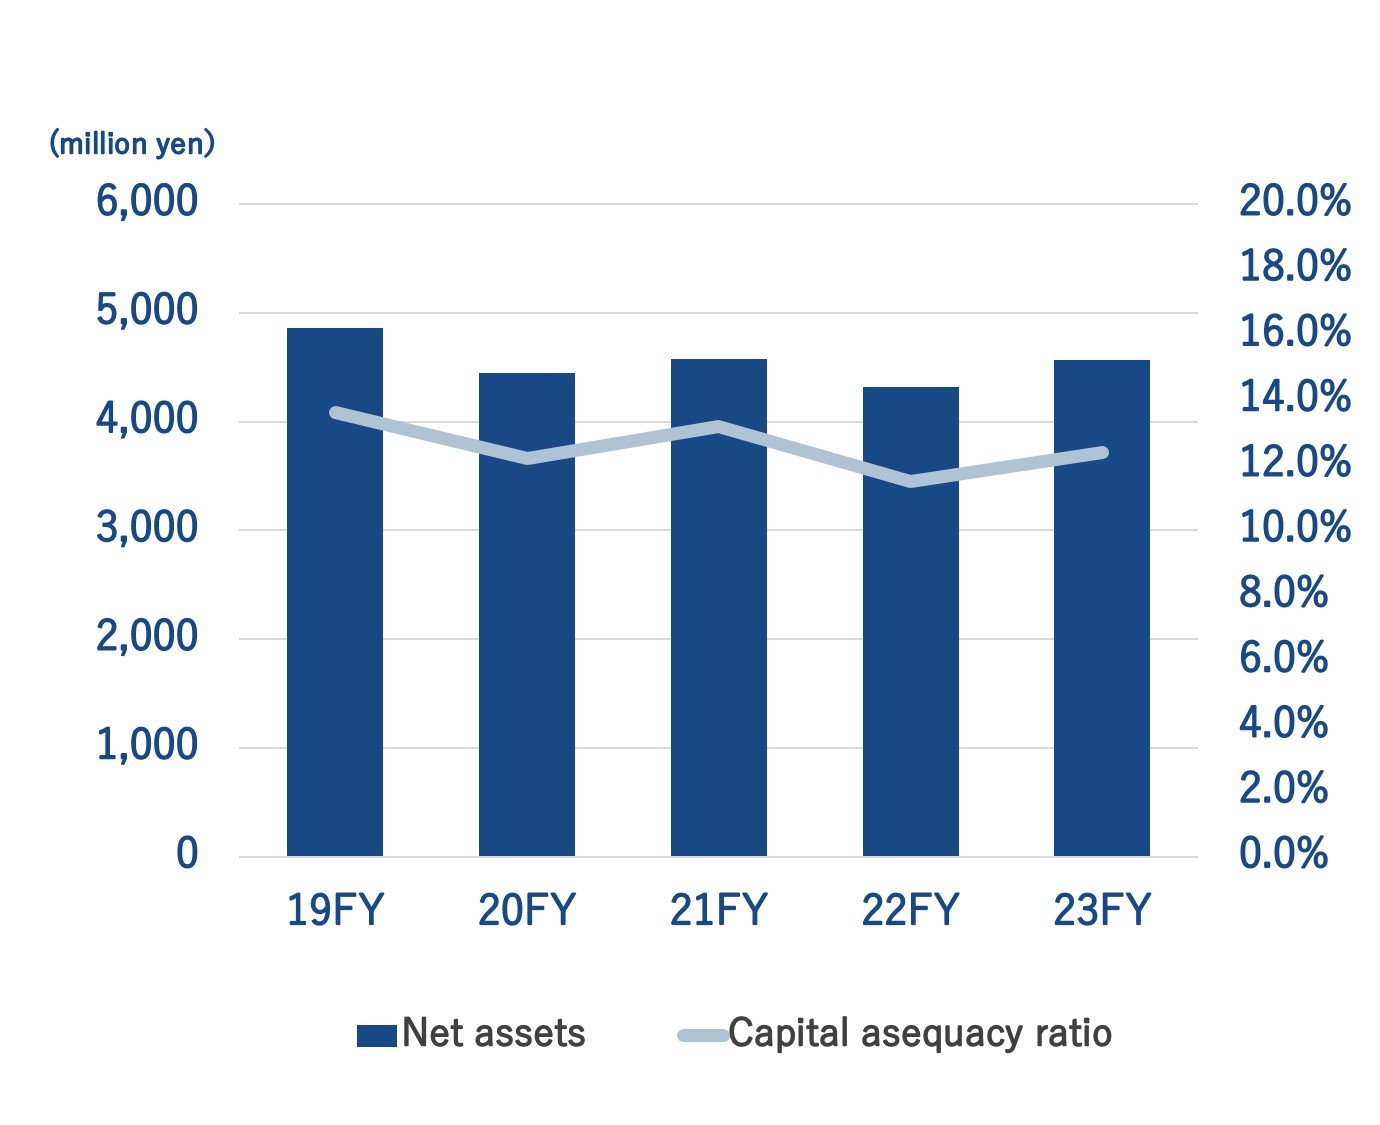
| Net assets | 4,861 | 4,443 | 4,578 | 4,315 | 4,567 |
| Capital adequacy ratio | 13.6% | 12.2% | 13.2% | 11.5% | 12.4% |
Total assets
Net assets and Capital adequacy ratio
CF
(Millions of yen)
| FY19 | FY20 | FY21 | FY22 | FY23 | |
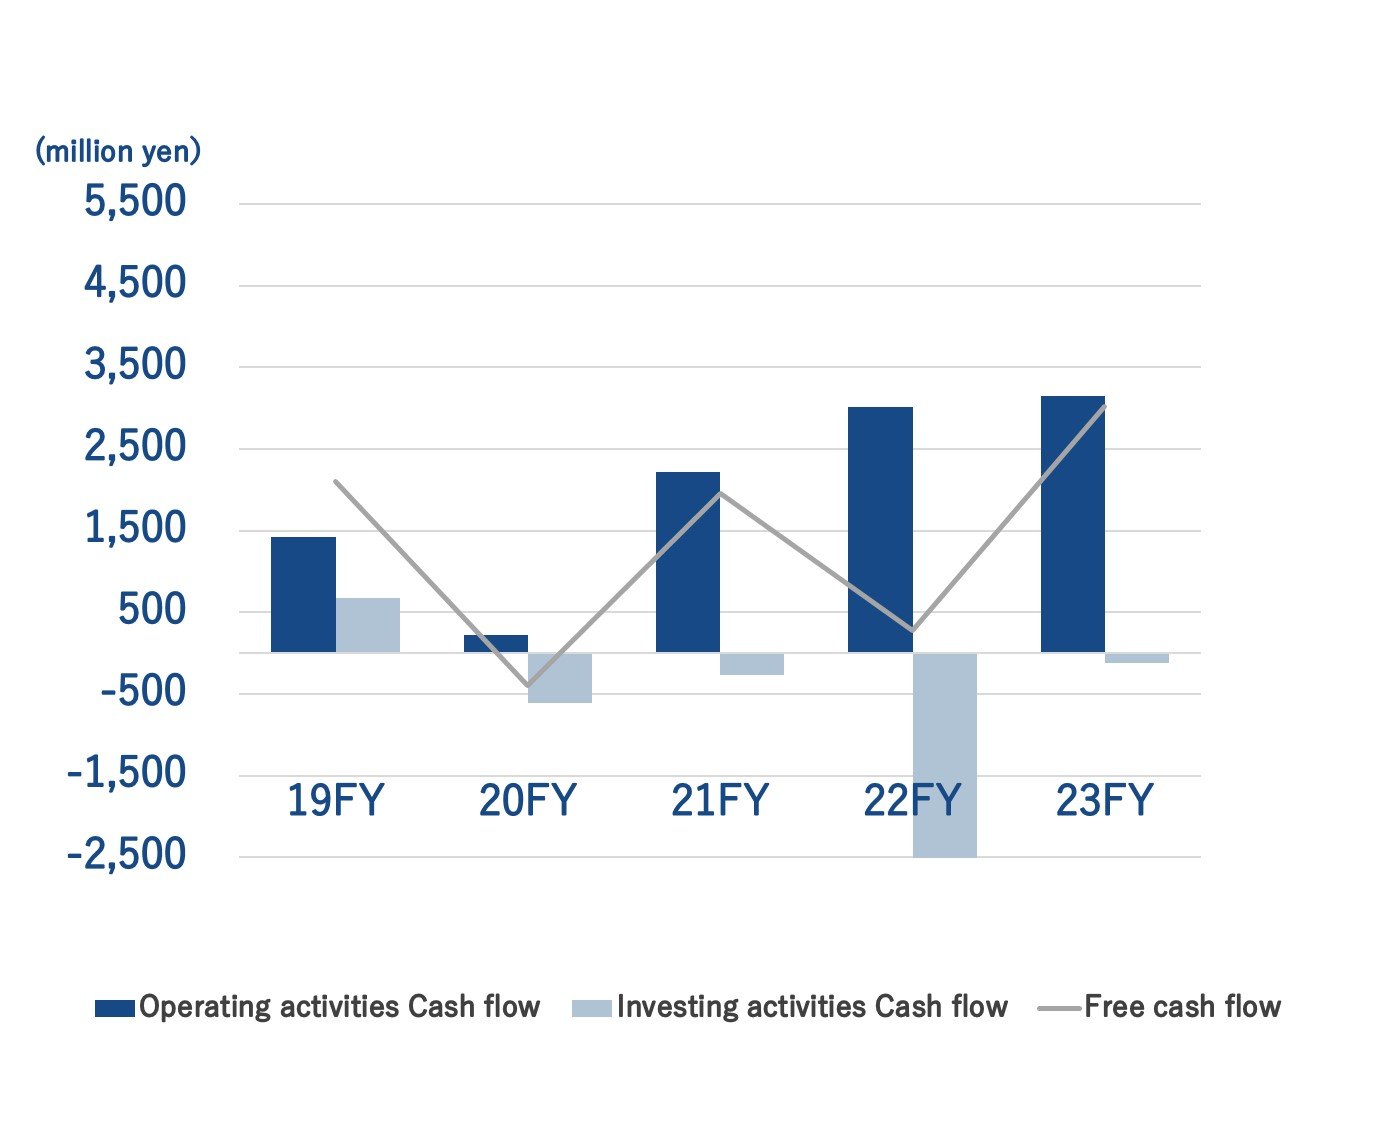
| Operating activities Cash flow | 1,425 | 224 | 2,222 | 3,013 | 3,146 |
| Investing activities Cash flow | 679 | -615 | -269 | -2,729 | -124 |
| Free cash flow | 2,104 | -391 | 1,953 | 284 | 3,022 |
| Financial activities Cash flow | -1,927 | -44 | -1,949 | 857 | -2,441 |
※Free Cash Flow = Operating activities Cash flow + Investing activities Cash flow
Operating activities Cash flow / Investing activities Cash flow / Free Cash flow
Main financial indicators
(Millions of yen)
| FY19 | FY20 | FY21 | FY22 | FY23 | |
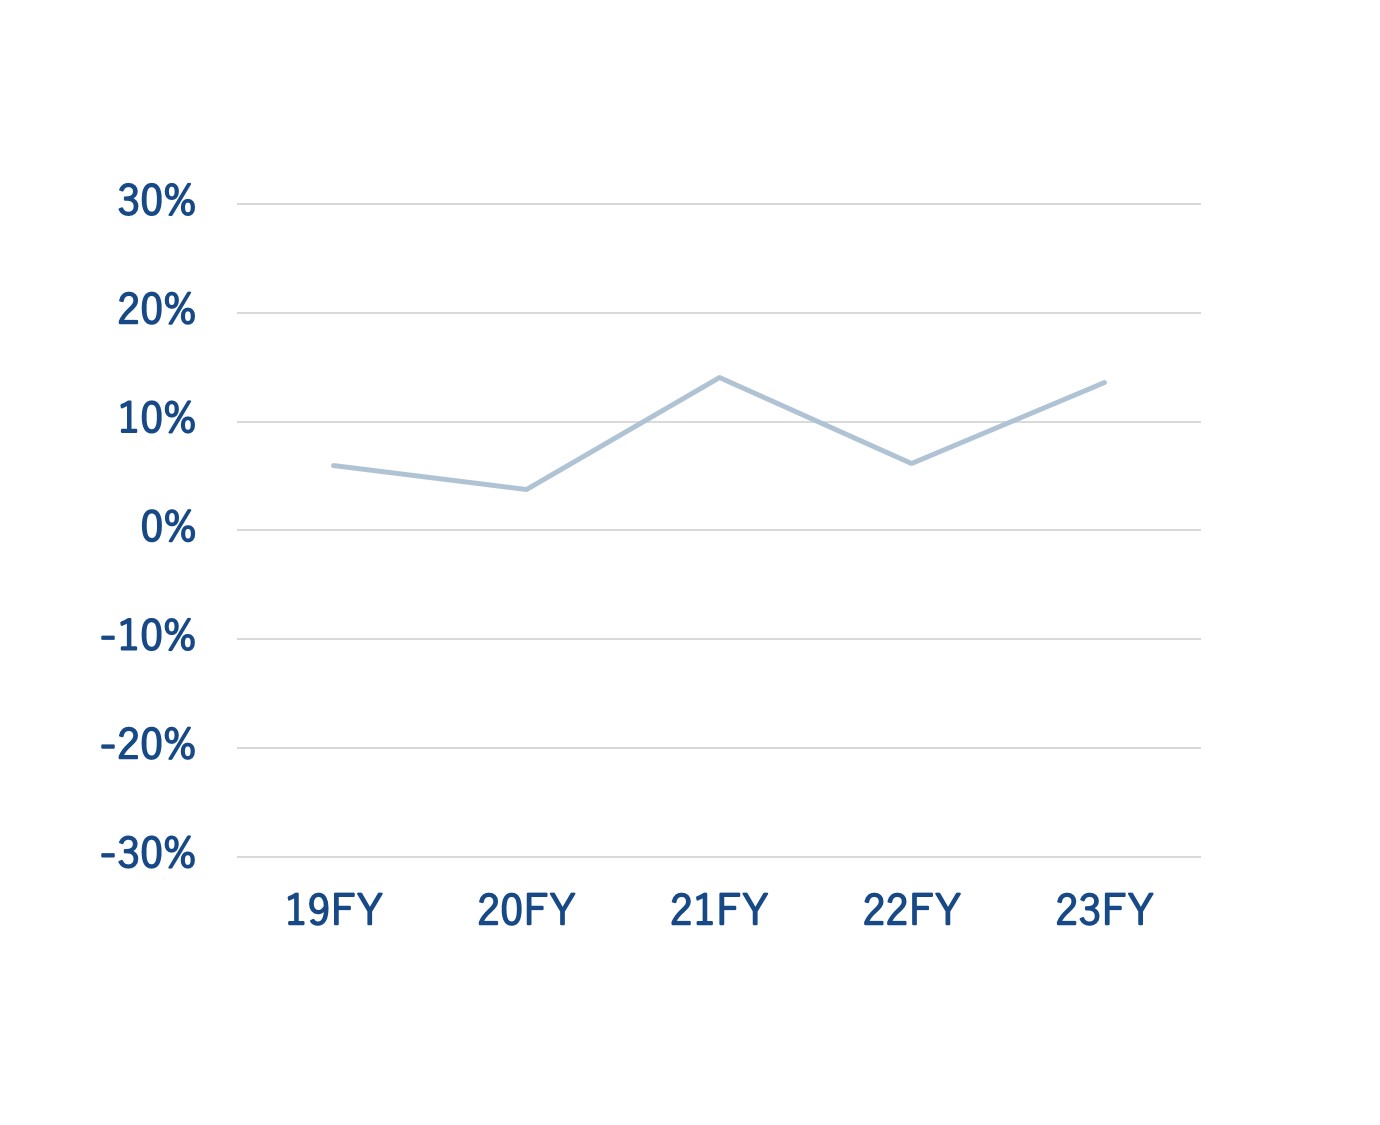
| ROE(%) | 6.0 | 3.8 | 14.1 | 6.2 | 13.6 |
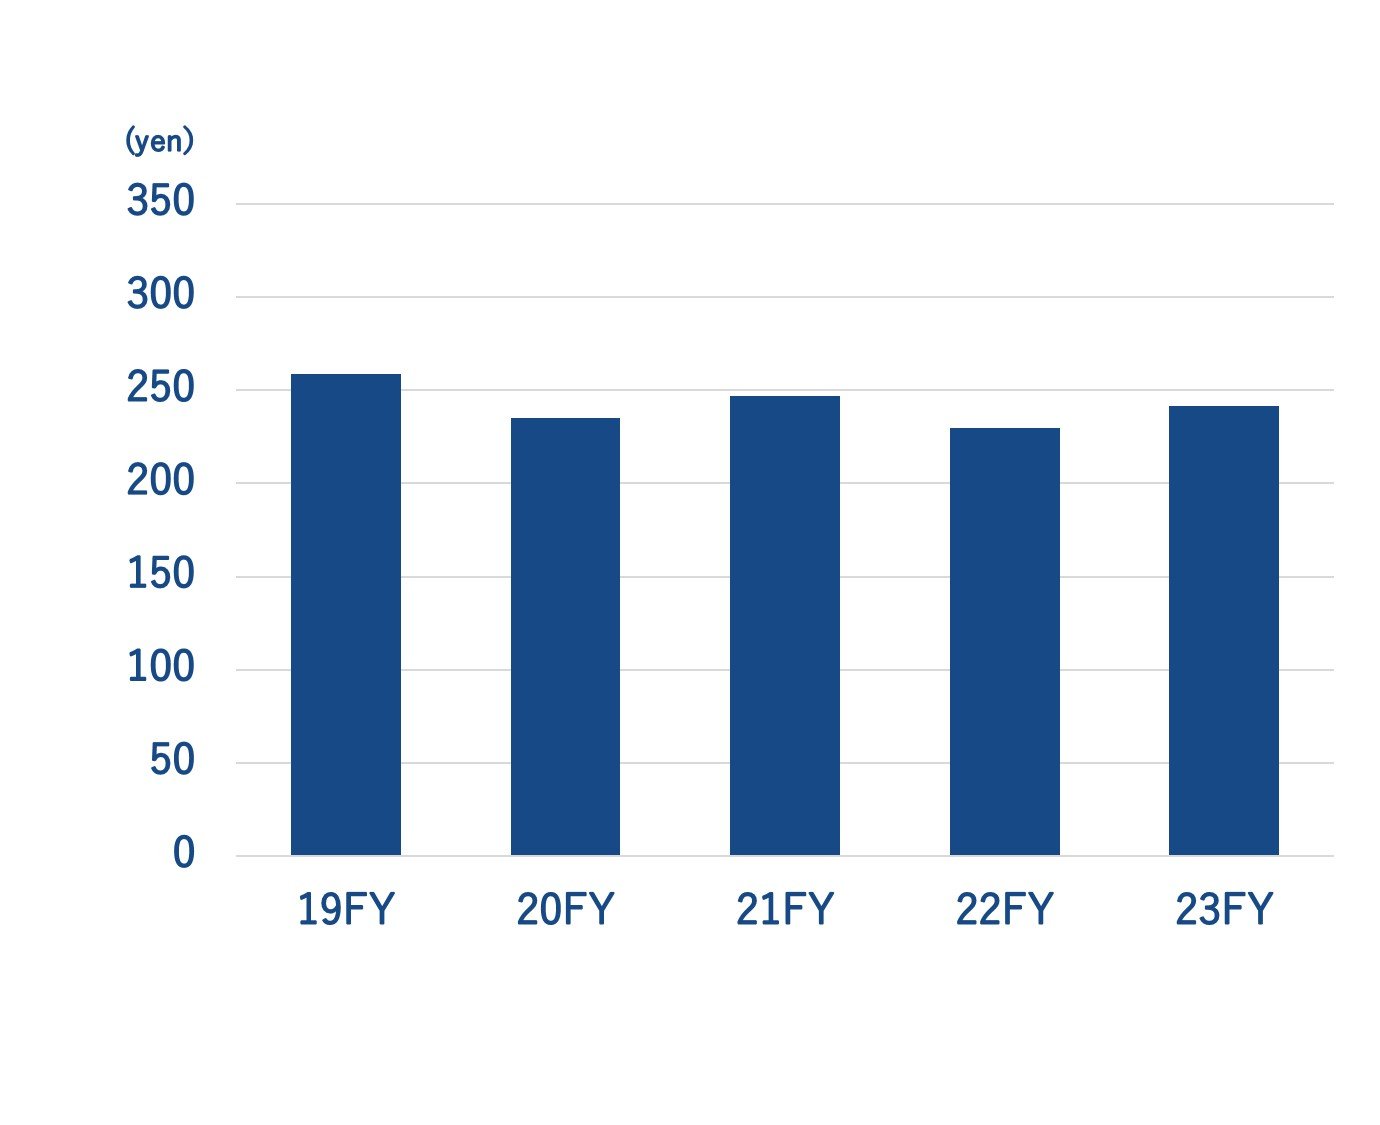
| BPS(yen) | 258.88 | 235.18 | 246.64 | 229.65 | 241.44 |
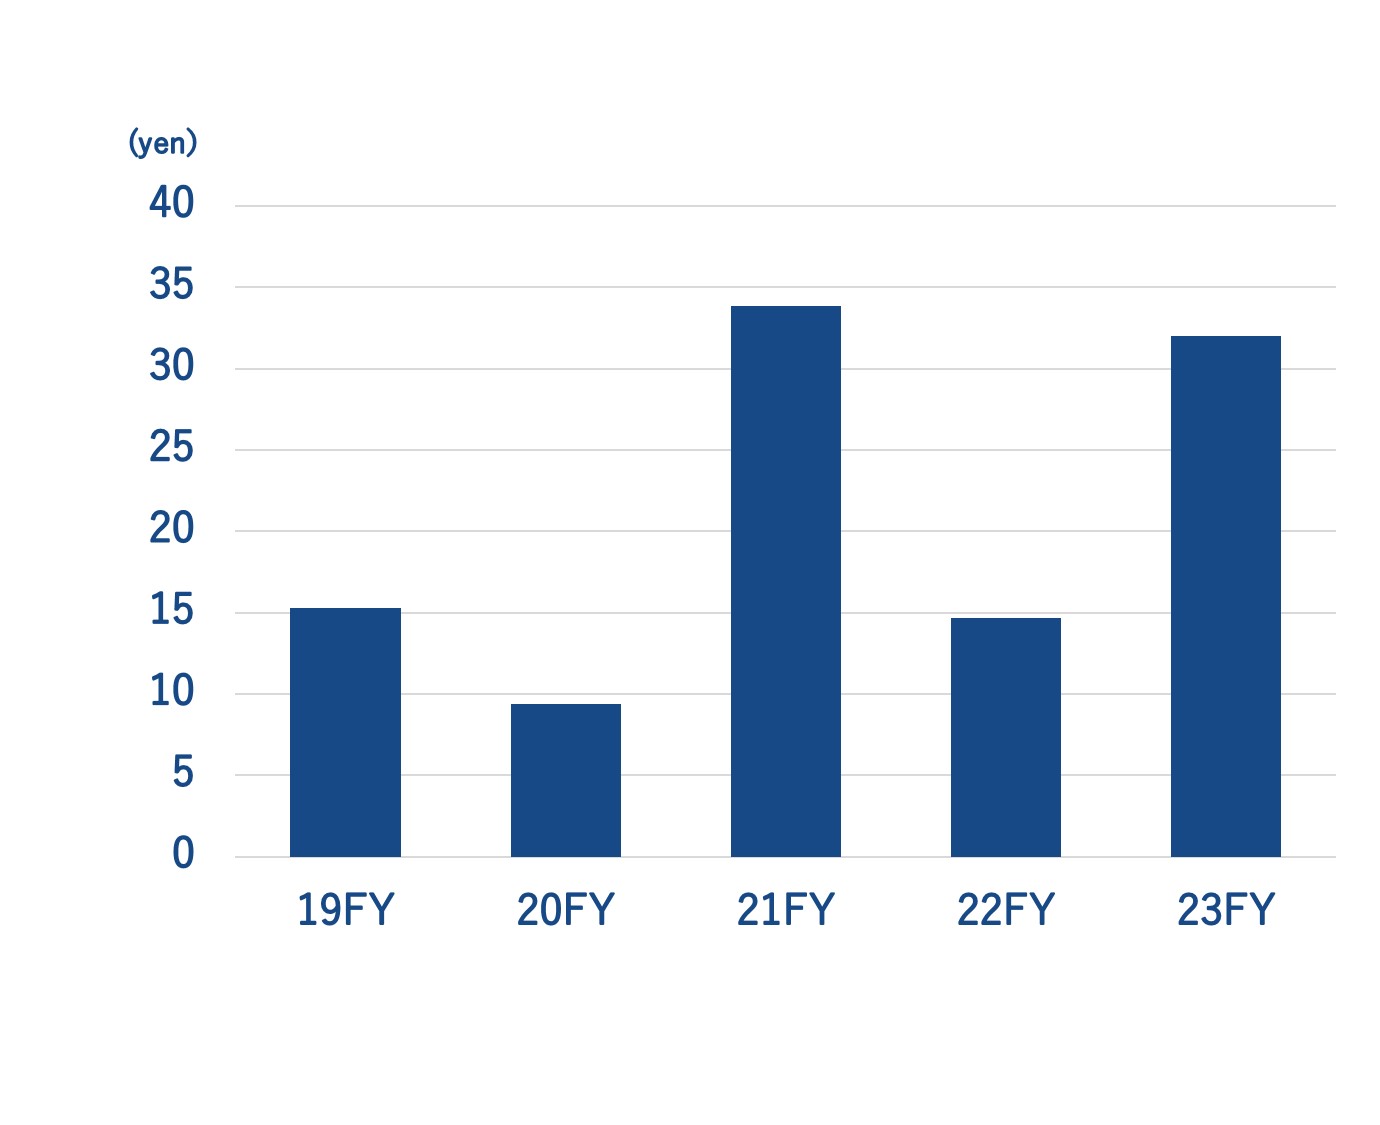
| EPS(yen) | 15.31 | 9.36 | 33.87 | 14.69 | 32.01 |
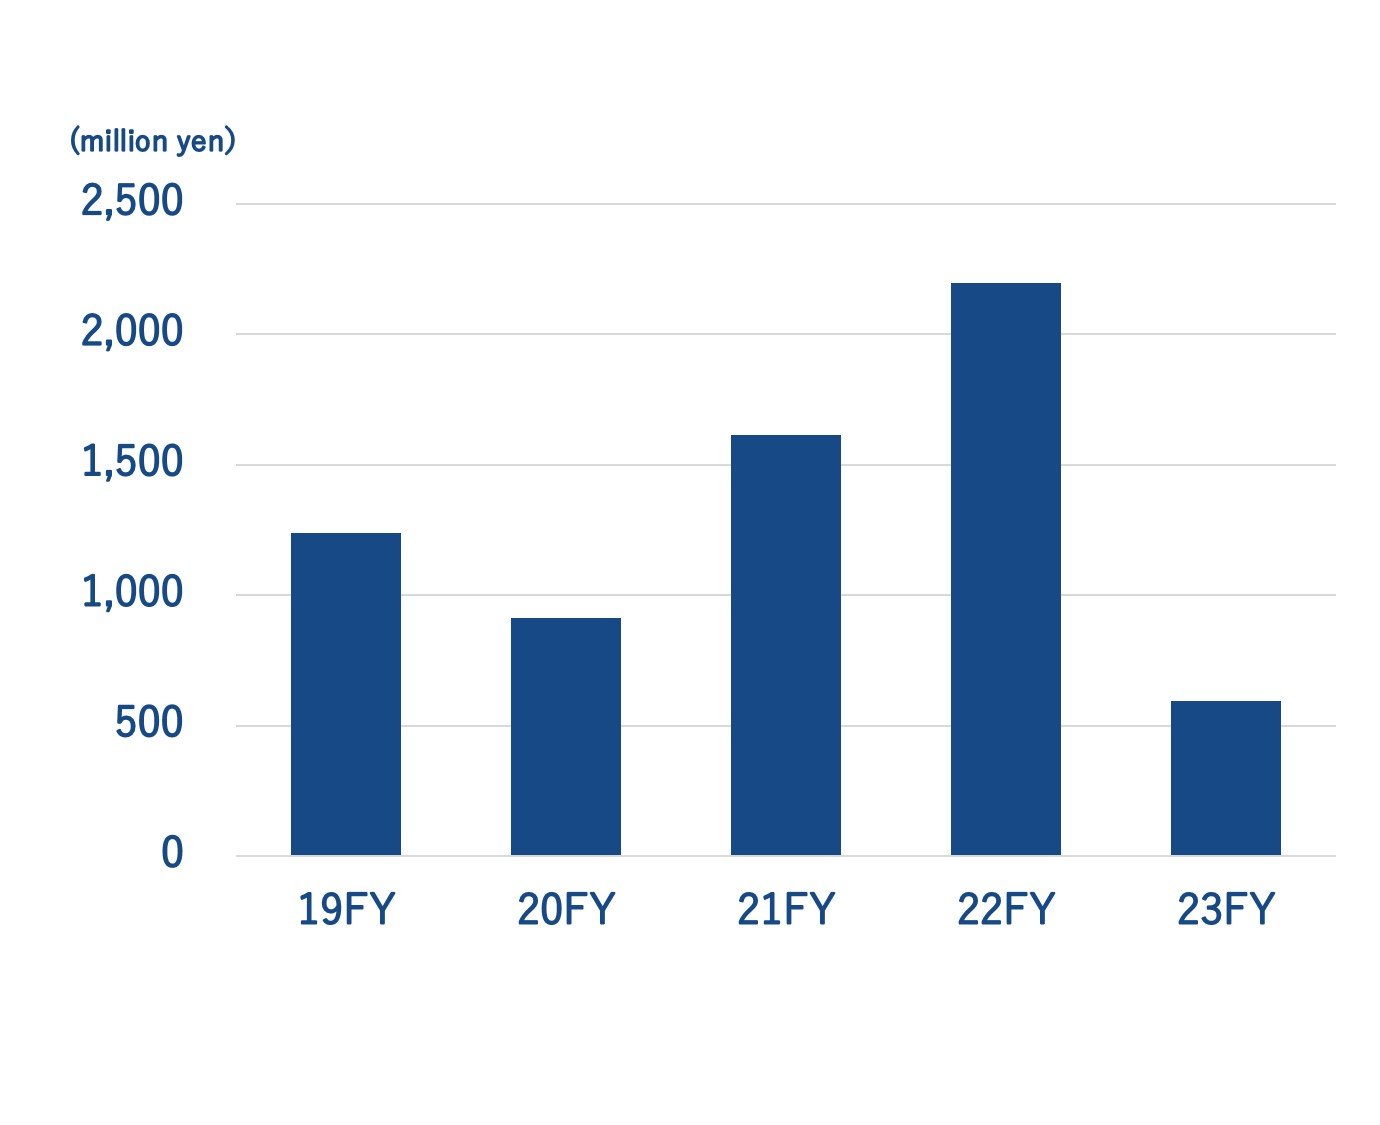
| Capital investment (millions of yen) |
1,239 | 911 | 1,614 | 2,195 | 596 |
*ROE=Profit/Average capital during the period×100
ROE
BPS
EPS
Capital investment